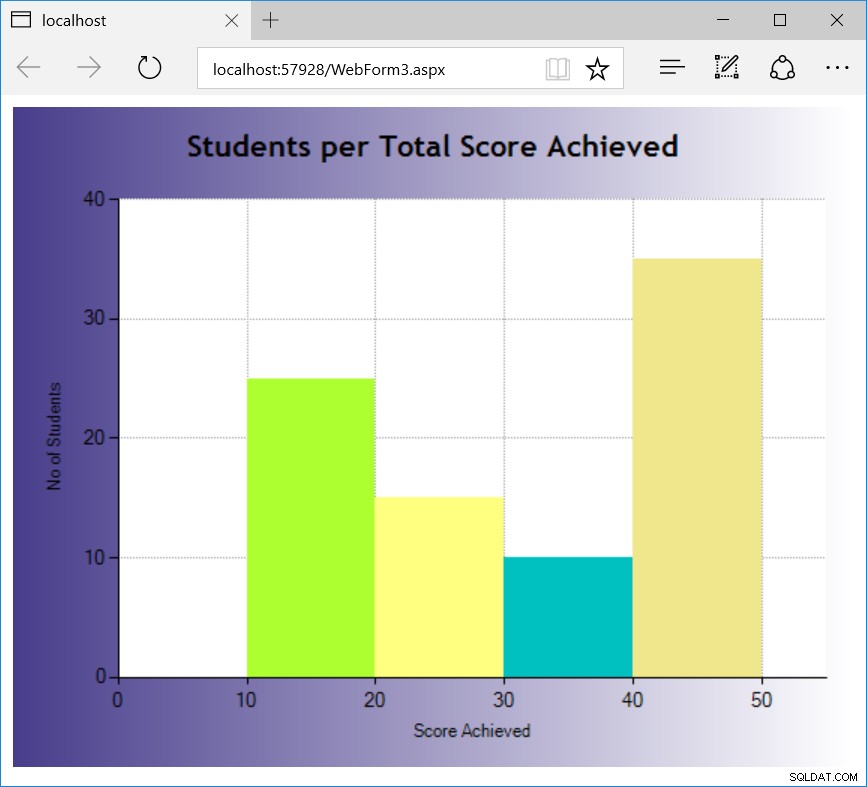
Consulte a continuación su ASPX original modificado para adaptarse al resultado deseado. Básicamente, debe hacer que su intervalo de cuadrícula principal sea el mismo que su rango de puntaje y hacer que cada XValue sea el punto medio de cada rango. Además, para que sus columnas llenen completamente el espacio, debe establecer la propiedad personalizada PointWidth=1 .
       <asp:Chart ID="Chart2" runat="server"  BackColor="DarkSlateBlue" BackGradientStyle="LeftRight"
       BorderlineWidth="0" Height="440px" Palette="SeaGreen" PaletteCustomColors="24, 0, 0"
       Width="560px" BorderlineColor="128, 128, 255" OnLoad="Chart2_Load">

            <Titles>
                <asp:Title Name="DefaultTitle" Font="Trebuchet MS, 15pt, style=Bold"
                           Text = "Students per Total Score Achieved" />
            </Titles>
            <%-- <Legends>
                     <asp:Legend Name="DefaultLegend" Enabled="True" Docking="Top" />
            </Legends>--%>

            <Series>
                <asp:Series Name="Series1" YValuesPerPoint="1" CustomProperties="PointWidth=1">
                    <Points>
                        <asp:DataPoint Color="GreenYellow" XValue="15" YValues="25" />
                        <asp:DataPoint Color="255, 255, 128" XValue="25" YValues="15" />
                        <asp:DataPoint Color="0, 192, 192" XValue="35" YValues="10" />
                        <asp:DataPoint Color="Khaki" XValue="45" YValues="35" />
                    </Points>
                </asp:Series>
            </Series>
            <ChartAreas>
                <asp:ChartArea Name="ChartArea1" >
                    <AxisY Title="No of Students ">
                        <MajorGrid LineColor="DarkGray" LineDashStyle="Dot" />
                    </AxisY>
                    <AxisX Title="Score Achieved" Minimum="0" Enabled="True">
                        <MajorGrid Interval="10" IntervalOffset="Auto" IntervalOffsetType="Number" IntervalType="Number" LineColor="DarkGray" LineDashStyle="Dot" />
                        <MajorTickMark Interval="10" IntervalOffset="Auto" IntervalOffsetType="Number" IntervalType="Number" />
                    </AxisX>
                    <AxisY2>
                        <LabelStyle TruncatedLabels="True" />
                    </AxisY2>
                </asp:ChartArea>
            </ChartAreas>
        </asp:Chart>
EDITAR: Tenga en cuenta que el color de cada punto se asigna explícitamente en el archivo aspx. Puede hacer lo mismo en el código subyacente usando colores predefinidos de una colección o generando colores aleatorios, como este:
Random r = new Random();
foreach (DataPoint dp in Chart2.Series[0].Points)
    dp.Color = Color.FromArgb(255, r.Next(100, 255), r.Next(100, 255), r.Next(100, 255));
EDICIÓN 2: Así es exactamente como se ve mi código ahora:
   <asp:Chart ID="Chart2" runat="server"  BackColor="DarkSlateBlue" BackGradientStyle="LeftRight"
   BorderlineWidth="0" Height="440px" Palette="SeaGreen" PaletteCustomColors="24, 0, 0"
   Width="560px" BorderlineColor="128, 128, 255" OnLoad="Chart2_Load">

        <Titles>
            <asp:Title Name="DefaultTitle" Font="Trebuchet MS, 15pt, style=Bold"
                       Text = "Students per Total Score Achieved" />
        </Titles>
        <%-- <Legends>
                 <asp:Legend Name="DefaultLegend" Enabled="True" Docking="Top" />
        </Legends>--%>

        <Series>
            <asp:Series Name="Series1" YValuesPerPoint="1" CustomProperties="PointWidth=1">
            </asp:Series>
        </Series>
        <ChartAreas>
            <asp:ChartArea Name="ChartArea1" >
                <AxisY Title="No of Students ">
                    <MajorGrid LineColor="DarkGray" LineDashStyle="Dot" />
                </AxisY>
                <AxisX Title="Score Achieved" Minimum="0" Enabled="True">
                    <MajorGrid Interval="10" IntervalOffset="Auto" IntervalOffsetType="Number" IntervalType="Number" LineColor="DarkGray" LineDashStyle="Dot" />
                    <MajorTickMark Interval="10" IntervalOffset="Auto" IntervalOffsetType="Number" IntervalType="Number" />
                </AxisX>
                <AxisY2>
                    <LabelStyle TruncatedLabels="True" />
                </AxisY2>
            </asp:ChartArea>
        </ChartAreas>
    </asp:Chart>
CS:
protected void Chart2_Load(object sender, EventArgs e)
{
    Chart2.Visible = true;
    /*
    SqlConnection connection = new SqlConnection(ConfigurationManager.ConnectionStrings["Con"].ConnectionString);

    SqlCommand cmd = new SqlCommand();
    cmd.Connection = connection;
    cmd.CommandType = CommandType.StoredProcedure;
    cmd.CommandText = "sp_range";
    cmd.Parameters.AddWithValue("@sub_code", DropDown_Subjects.SelectedItem.Value);

    //  cmd.ExecuteNonQuery();

    connection.Open();
    SqlDataReader dr = cmd.ExecuteReader(CommandBehavior.CloseConnection);
    */

    Chart2.DataSource = dt;

    Chart2.Series[0].XValueMember = "Score_Achieved";
    Chart2.Series[0].YValueMembers = "No_of_Students";

    Chart2.DataBind();

    Random r = new Random();
    foreach (DataPoint dp in Chart2.Series[0].Points)
        dp.Color = Color.FromArgb(255, r.Next(100, 255), r.Next(100, 255), r.Next(100, 255));

    //connection.Close();
}