Para agregar semanas/textual
datos debajo de las columnas, debe agregar el archivo de categorías de la biblioteca jquery.flot.categories.min.js a sus activos javascript.
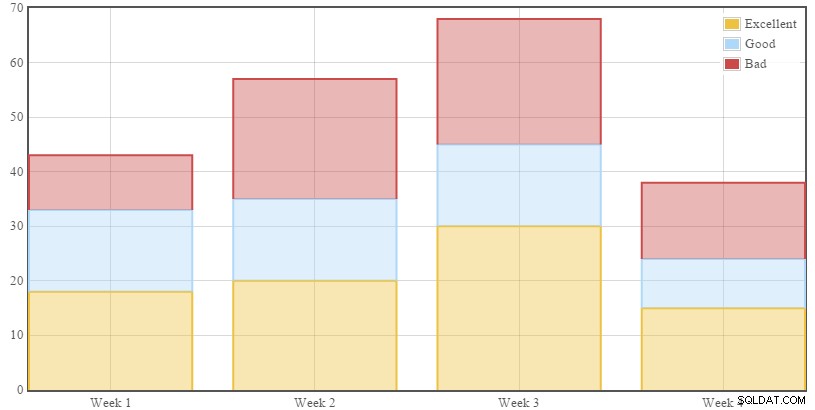
Si te entiendo correctamente, quieres que el gráfico se vea así
Javascript
Necesita agregar estos archivos en
<script src="//ajax.googleapis.com/ajax/libs/jquery/1.11.1/jquery.min.js"></script>
<script src="jquery.flot.min.js"></script>
<script src="jquery.flot.categories.min.js"></script>
<script src="jquery.flot.stack.min.js"></script>
e inicializar la biblioteca, hablaremos sobre $output después de este código
<div id="placeholder" style="width:818px;height:413px" ></div>
<script type="text/javascript">
$(function() {
    var series = [<?php echo $output; ?>];
       $.plot("#placeholder", series, {
        series: {
            stack:true,
            lines:{fill:true,show:false,steps:false},
            bars: {
                show: true,
                barWidth: 0.8,
                align: "middle",
            },
        },
        xaxis: {
            mode: "categories",
            minTickSize: 1
        }
       });
});
PHP
Primero debe consultar la base de datos para encontrar la fecha entre las fechas especificadas, después de obtener el resultado, debe ordenar los datos de cada semana en una matriz
Por ejemplo, week One => 'good','good','bad','bad', 'week two' => and so on ...
después de eso, puede usar array_count_values()
para contar el número de ocurrencias y construir la columna de gráficos.
Simplifiqué el código usando functions para hacértelo más fácil
<?php
$con = mysqli_connect("localhost", 'root','','your db');

function getChartData($con, $startDate, $endDate){

    $startDate = date("Y-m-d H:i:s", strtotime($startDate));
    $endDate = date("Y-m-d H:i:s", strtotime($endDate));

    $query = "SELECT * FROM `employees` WHERE `date` BETWEEN '$startDate' AND '$endDate'";

    $result = mysqli_query($con, $query) or die ("Error: ".mysqli_error($con));

    // a multidimenional array containing each week with it's
    $weeksData = [];

    // Group each week with it's data
    while($row = mysqli_fetch_array($result)){
        $weekNumber = date("W", strtotime($row['date']));
        if(isset($weeksData[$weekNumber]))
        {
            $weeksData[$weekNumber][] = $row['level'];
        }
        $weeksData[$weekNumber][] = $row['level'];
    }

    // reset array indexes and sort the array
    sort($weeksData);

    $data = array();

    // using array_count_values to count the number of (good, bad and excellent)
    foreach ($weeksData as $key => $week) {
        $data[$key] = array_count_values($week);
    }

    // return all the weeks with number of (good, bad and excellent) occurences
    return $data;
}

// build the javascript object {data:['week num', occuerences]}
function buildColumn($data,$label, $numberOfWeeks)
{
    $data = array_column($data,strtolower($label));
    $balance = $numberOfWeeks - count($data);
    if($balance !=0){
        for($i=1;$i<=$balance;$i++) {
            $data[] = 1;
        }
    }

    $string = '{data: [';
    foreach ($data as $key => $value) {
        $weekNumber = $key+1;
        $string .= '["Week '.$weekNumber.'",'.$value.'],';
    }
    $string = rtrim($string, ',');
    $string .= "],valueLabels: {show: true,valign: 'middle'},label: '$label'}";
    return $string;
}

function getNumberofWeeks($startDate, $endDate){
      $weeks = array();
      $period = new DatePeriod(new DateTime($startDate),
        DateInterval::createFromDateString('+1 day'),new DateTime($endDate)
      );
      foreach ( $period as $dt ) {
        $weeks[] = $dt->format( 'W' );
      }
      return count(array_unique($weeks));
}
ahora puedes usar estas funciones fácilmente como esta
$numberOfWeeks = getNumberofWeeks($_POST['start'],$_POST['end']);

// get data of the last number of weeks
$chartData = getChartData($con, $_POST['start'],$_POST['end']);
// bulding columns data for each occurence
$badColumn = buildColumn($chartData,'Bad', $numberOfWeeks);
$goodColumn = buildColumn($chartData,'Good', $numberOfWeeks);
$excellentColumn = buildColumn($chartData,'Excellent', $numberOfWeeks);

// output {data: ...}, {data: ...},{data:....}
$output = "$excellentColumn , $goodColumn , $badColumn";
Ejemplo de trabajo completo
<!DOCTYPE html>
<html>
<head>
    <title></title>
    <script src="//ajax.googleapis.com/ajax/libs/jquery/1.11.1/jquery.min.js"></script>
    <script src="jquery.flot.min.js"></script>
    <script src="jquery.flot.categories.min.js"></script>
    <script src="jquery.flot.stack.min.js"></script>
</head>
<body>
<?php
$con = mysqli_connect("localhost", 'root','','your db');

function getChartData($con, $startDate, $endDate){

    $startDate = date("Y-m-d H:i:s", strtotime($startDate));
    $endDate = date("Y-m-d H:i:s", strtotime($endDate));

    $query = "SELECT * FROM `employees` WHERE `date` BETWEEN '$startDate' AND '$endDate'";

    $result = mysqli_query($con, $query) or die ("Error: ".mysqli_error($con));

    // a multidimenional array containing each week with it's
    $weeksData = [];

    // Group each week with it's data
    while($row = mysqli_fetch_array($result)){
        $weekNumber = date("W", strtotime($row['date']));
        if(isset($weeksData[$weekNumber]))
        {
            $weeksData[$weekNumber][] = $row['level'];
        }
        $weeksData[$weekNumber][] = $row['level'];
    }

    // reset array indexes and sort the array
    sort($weeksData);

    $data = array();

    // using array_count_values to count the number of (good, bad and excellent)
    foreach ($weeksData as $key => $week) {
        $data[$key] = array_count_values($week);
    }

    // return all the weeks with number of (good, bad and excellent) occurences
    return $data;
}

// build the javascript object {data:['week num', occuerences]}
function buildColumn($data,$label, $numberOfWeeks)
{
    $data = array_column($data,strtolower($label));
    $balance = $numberOfWeeks - count($data);
    if($balance !=0){
        for($i=1;$i<=$balance;$i++) {
            $data[] = 1;
        }
    }

    $string = '{data: [';
    foreach ($data as $key => $value) {
        $weekNumber = $key+1;
        $string .= '["Week '.$weekNumber.'",'.$value.'],';
    }
    $string = rtrim($string, ',');
    $string .= "],valueLabels: {show: true,valign: 'middle'},label: '$label'}";
    return $string;
}

function getNumberofWeeks($startDate, $endDate){
      $weeks = array();
      $period = new DatePeriod(new DateTime($startDate),
        DateInterval::createFromDateString('+1 day'),new DateTime($endDate)
      );
      foreach ( $period as $dt ) {
        $weeks[] = $dt->format( 'W' );
      }
      return count(array_unique($weeks));
}
// the number of weeks that you want to display in the chart
$numberOfWeeks = getNumberofWeeks($_POST['start'],$_POST['end']);

// get data of the last number of weeks
$chartData = getChartData($con, $_POST['start'],$_POST['end']);
// bulding columns data for each occurence
$badColumn = buildColumn($chartData,'Bad', $numberOfWeeks);
$goodColumn = buildColumn($chartData,'Good', $numberOfWeeks);
$excellentColumn = buildColumn($chartData,'Excellent', $numberOfWeeks);

// output {data: ...}, {data: ...},{data:....}
$output = "$excellentColumn , $goodColumn , $badColumn";

?>
<div id="placeholder" style="width:818px;height:413px" ></div>
<script type="text/javascript">
$(function() {
    var series = [<?php echo $output; ?>];
       $.plot("#placeholder", series, {
        series: {
            stack:true,
            lines:{fill:true,show:false,steps:false},
            bars: {
                show: true,
                barWidth: 0.8,
                align: "middle",
            },
        },
        xaxis: {
            mode: "categories",
            minTickSize: 1
        }
       });
});
  </script>
 </body>
</html>
Editar
Simplemente reemplace estas dos funciones para que sea compatible con dd/mm/yyyy
 function getChartData($con, $startDate, $endDate){
    $startDate = explode('/', $startDate);
    $startDate = $startDate[1] . '/' . $startDate[0] . '/' . $startDate[2];

    $endDate = explode('/', $endDate);
    $endDate = $endDate[1] . '/' . $endDate[0] . '/' . $endDate[2];

    $startDate = date("Y-m-d H:i:s", strtotime($startDate));
    $endDate = date("Y-m-d H:i:s", strtotime($endDate));

    $query = "SELECT * FROM `employees` WHERE `date` BETWEEN '$startDate' AND '$endDate'";

    $result = mysqli_query($con, $query) or die ("Error: ".mysqli_error($con));

    // a multidimenional array containing each week with it's
    $weeksData = [];

    // Group each week with it's data
    while($row = mysqli_fetch_array($result)){
        $weekNumber = date("W", strtotime($row['date']));
        if(isset($weeksData[$weekNumber]))
        {
            $weeksData[$weekNumber][] = $row['level'];
        }
        $weeksData[$weekNumber][] = $row['level'];
    }

    // reset array indexes and sort the array
    sort($weeksData);

    $data = array();

    // using array_count_values to count the number of (good, bad and excellent)
    foreach ($weeksData as $key => $week) {
        $data[$key] = array_count_values($week);
    }

    // return all the weeks with number of (good, bad and excellent) occurences
    return $data;
}
y
   function getNumberofWeeks($startDate, $endDate){
    $startDate = explode('/', $startDate);
    $startDate = $startDate[1] . '/' . $startDate[0] . '/' . $startDate[2];

    $endDate = explode('/', $endDate);
    $endDate = $endDate[1] . '/' . $endDate[0] . '/' . $endDate[2];
    $diff = strtotime($startDate, 0) - strtotime($endDate, 0);

    return str_replace('-','', (int)floor($diff / 604800));
}